Most Dreaded Terror 15 Long House Valley
It is the 24 of March, 2018. Here is the survival experience of a community of native American farmers in the American Southwest in a place called Long House Valley.
Jared M. Diamond, “Life with the Artificial Anasazi,” NATURE, vol. 419 no 6907, October 10, 2002 p 567
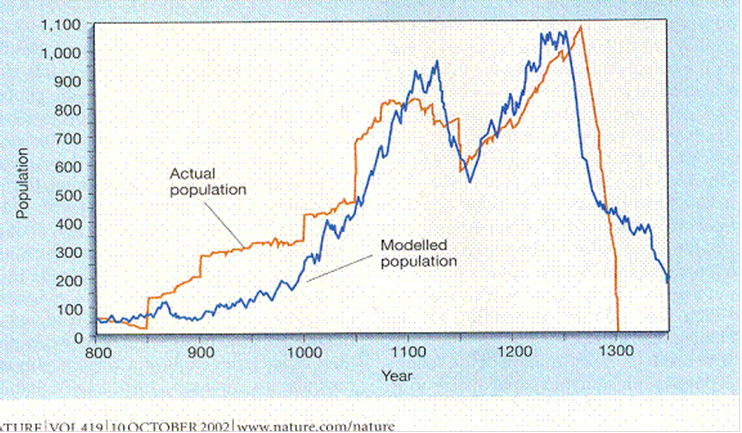
- Diamond’s excellent work here deserves close study. Of course, you see the notch, which we have seen in humans two or three times already. The red line, “actual population,” is an estimate of the population reached by doing carbon 14 dating on every bit of charcoal they could find in the valley. That gave them a number of houses that were occupied in any one year. From that they calculated a population. Obviously this is a more direct measure that simply looking at how likely a dynasty is to fail and inferring a lack of capable people. So we are not surprised to see that the notch in the population curve is a good deal deeper than the notches in the dynasty curves.
- The blue line, “modelled population,” is a measure of the climate estimated from tree ring widths during the years in question. A computer matched the curves to give a closest fit. The match is so good that it seems inescapable that there is a causal connection. Either the tree rings are causing the population to change, the population is causing changes in the tree rings or they are both the result of some other factor.
- Diamond went for number three: the tree rings reflect rainfall, and rainfall limits the number of people the valley can sustain. Since number one is not viable, number three seems reasonable, but it is not perfect.
- Starting in the year 800, some people move in; their numbers decline. If the people came from a traditional community, that community was probably in good balance, the size being about right for zero growth as predicted by the Sibly curve. Since only about 50 people seem to have come, that would be a very few families, and they are dealing with inbreeding depression.
- In 850, more people move in, and the population begins to grow. That on the face of it is a puzzle. Rainfall as inferred from tree rings should not be able sustain them, much less permit population growth.
- The years 1000 and 1050 show the same thing: immigration into the valley and growth that should not be sustainable. All the while the tree rings indicate more and more growth. By 1100 the trees are suggesting that the valley can sustain 16 times as many as it could 300 years before.
- I do not in any way mean to cast a shadow and this fine study. Diamond has asked the right question and put together a large amount of relevant data. What happens to a population if you just cut it loose and let it run. Diamond suggests that population declines are due to people moving away when they cannot support themselves in the valley. But the evidence suggests that these people move in groups, and after the 1050 migration there is no unequivocal instance of any migration. War, famine and plague should show a stepwise decrease indistinguishable from an exodus is numbers were significantly affected.
- And from the migration of the year 1000 to the end when the valley fell empty would be 300 years. Thus it appears that these subsistence farmers had the same population time course and the same profile – notch and all – as the course and profile of dynasties that ruled all of Asia. It’s all mating pool size and kinship. Accident of status means nothing. Actually there is the question of folic acid we have yet to describe, and of course cheap cloning of humans might potentially change much in the future. But our evidence comes from the past.
- Notice in closing that of the two population peaks, the second is higher than the first. We shall see that again in another context.
YouTube video script directory
Home page